- Home
- About Pixie
- Installing Pixie
- Using Pixie
- Tutorials
- Reference
This tutorial shows you how to automatically convert a PxL Script into an OpenTelemetry export script that can be used with a Pixie plugin. Plugin scripts make it easy to extend Pixie's capabilities: you can enable a wide-range of use-cases including long-term storage and control signals for autoscalers.
We released the OpenTelemetry Exporter and Plugin System a few months before, but we got a lot of feedback that writing export scripts was long and repetitive.
We built this new flow to automate out the tedious parts of writing export scripts.
You will need a Kubernetes cluster. If you don’t already have one, you can create a minikube cluster following the directions here.
You will need to install Pixie on your cluster using one of our install guides.
You will need to setup a Pixie plugin. You can setup a simple demo collector to try the feature out.
PxL scripts are used to query telemetry data collected by the Pixie Platform. Here we will write a script that calculates the throughput of requests through each endpoint of each pod in your cluster. In the following section, we'll convert the script into an OpenTelemetry export script.
We'll use the Live UI's Scratch Pad to develop our PxL script.
Open Pixie's Live UI.
Select the
Scratch Padscript from thescriptdrop-down menu in the top left.Open the script editor using the keyboard shortcut:
ctrl+e(Windows, Linux) orcmd+e(Mac).Replace the contents of the
PxL Scripttab with the following.
1import px2# Read in the http_events table3df = px.DataFrame(table='http_events', start_time='-10s', end_time=px.now())45# Attach the pod and service metadata6df.pod = df.ctx['pod']7df.service = df.ctx['service']8# Count the number of requests per pod and service9df = df.groupby(['pod', 'service', 'req_path']).agg(10 throughput=('latency', px.count),11 time_=('time_', px.max),12)1314px.display(df, 'http')
Run the script using the
RUNbutton in the top right or by using the keyboard shortcut:ctrl+enter(Windows, Linux) orcmd+enter(Mac).Hide the script editor using
ctrl+e(Windows, Linux) orcmd+e(Mac).
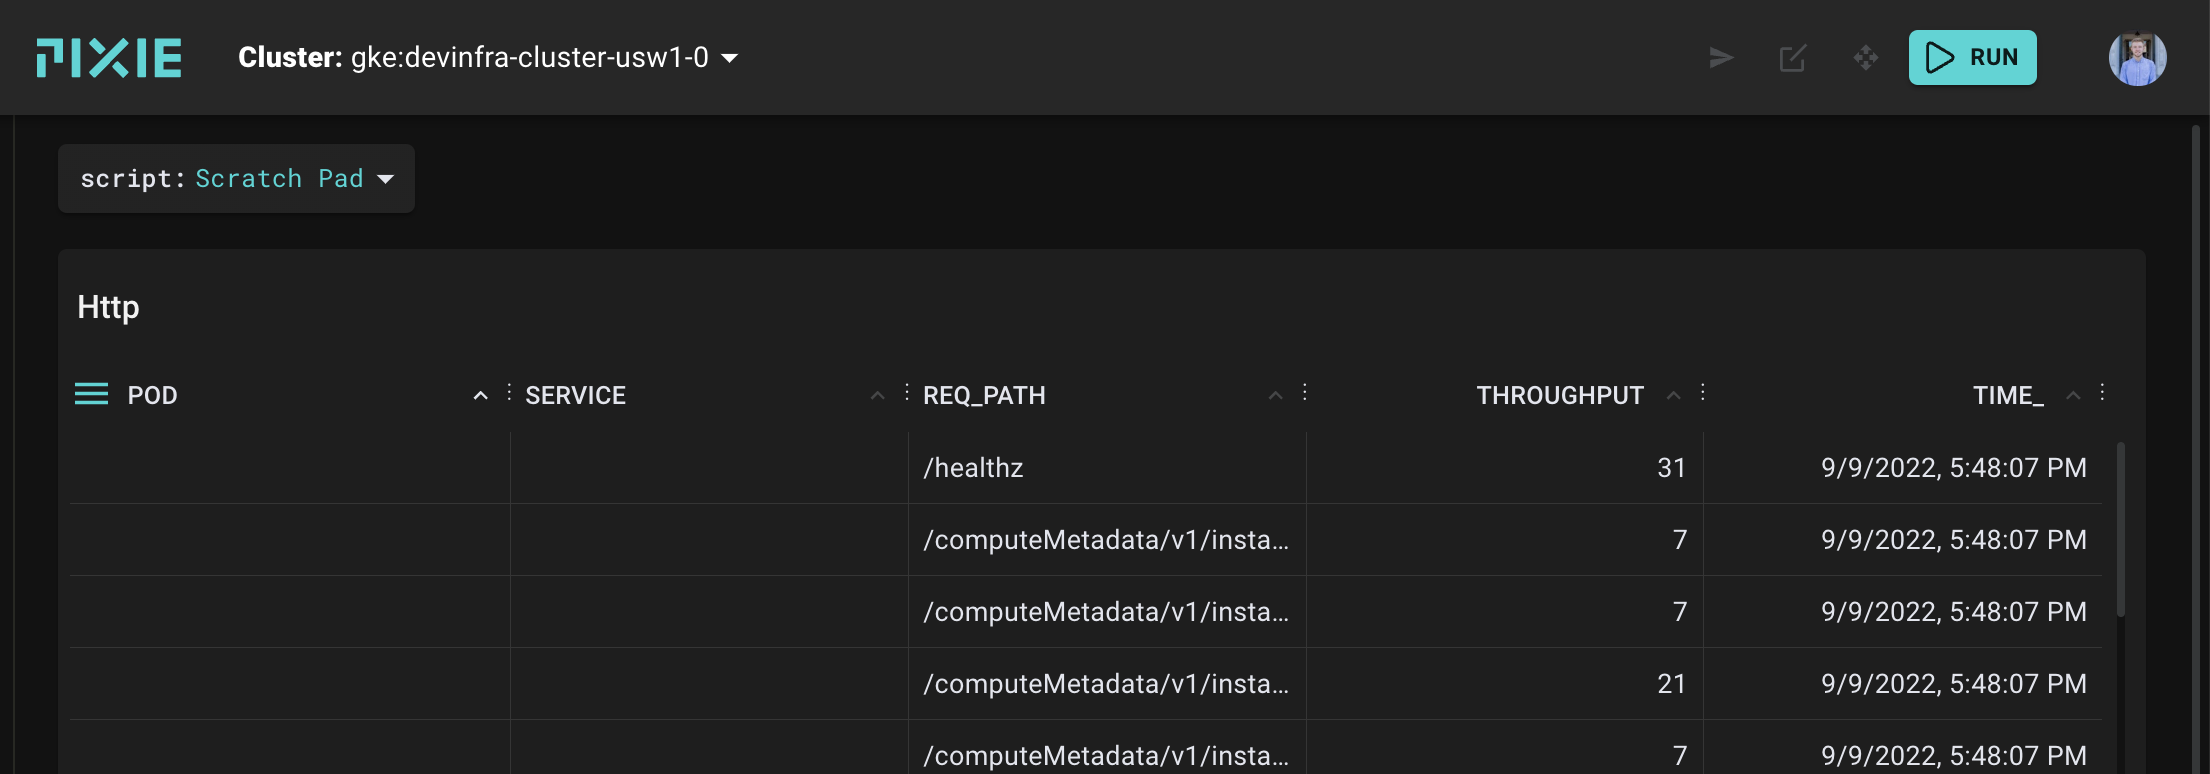
Your Live UI should output something similar to the following:

This PxL script calculates the throughput of HTTP requests made to each pod in your cluster.
Now that we have our PxL script, let's export it.
Open the script editor again (
ctrl+eorcmd+e)On the top right corner, click "Export to Plugin". Pixie will process the script and attempt to generate an OpenTelemetry export configuration for it.

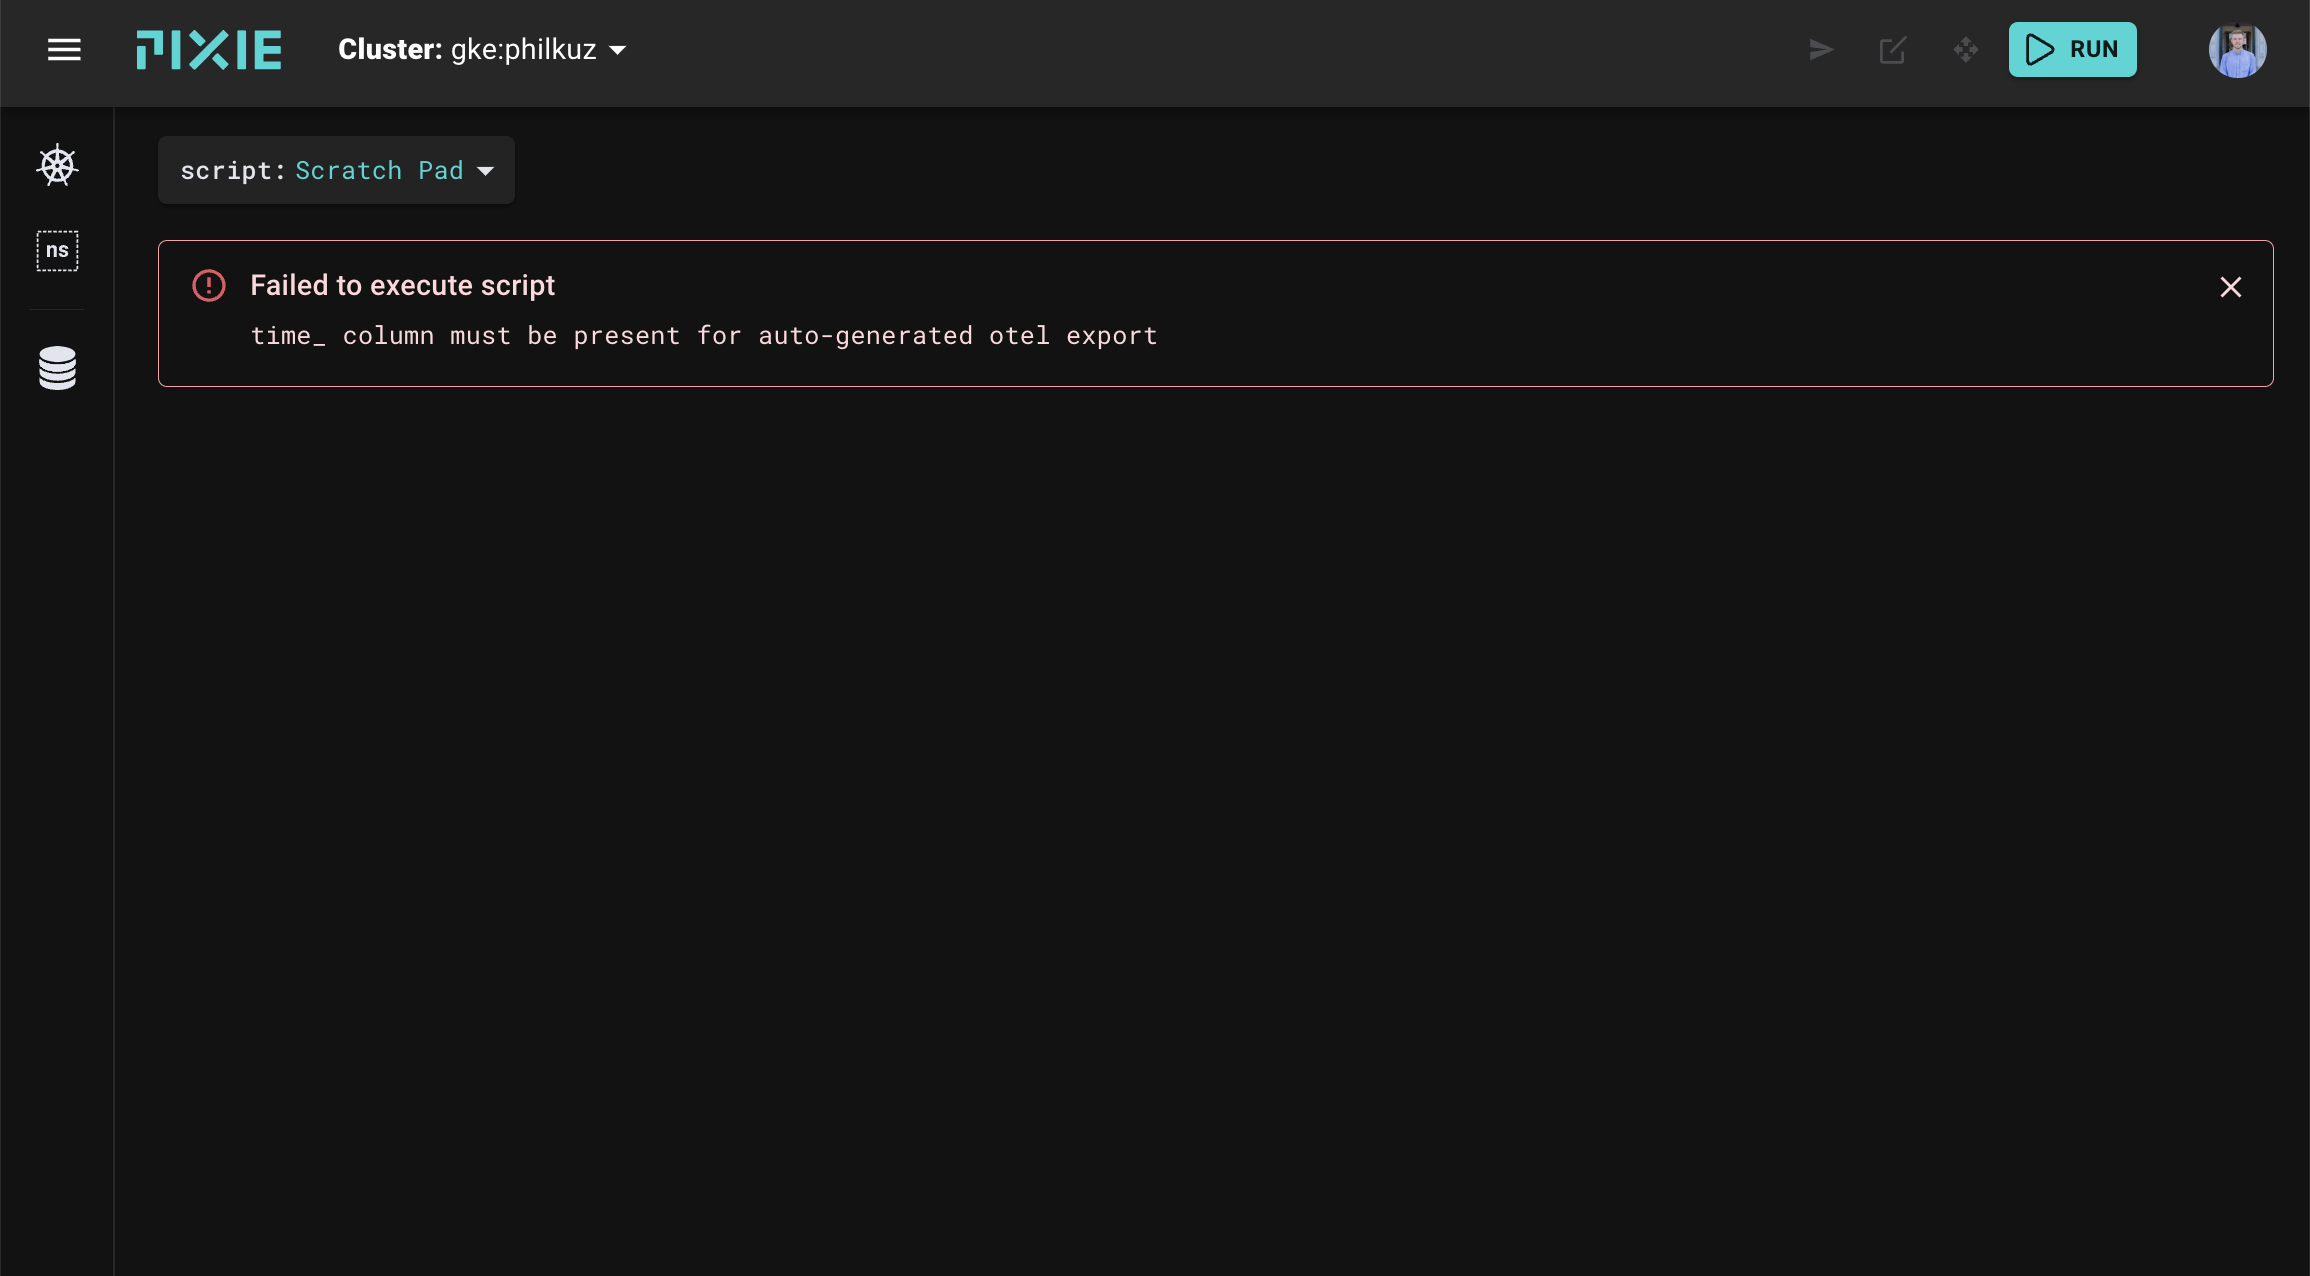
If the export fails, you'll see an error message.

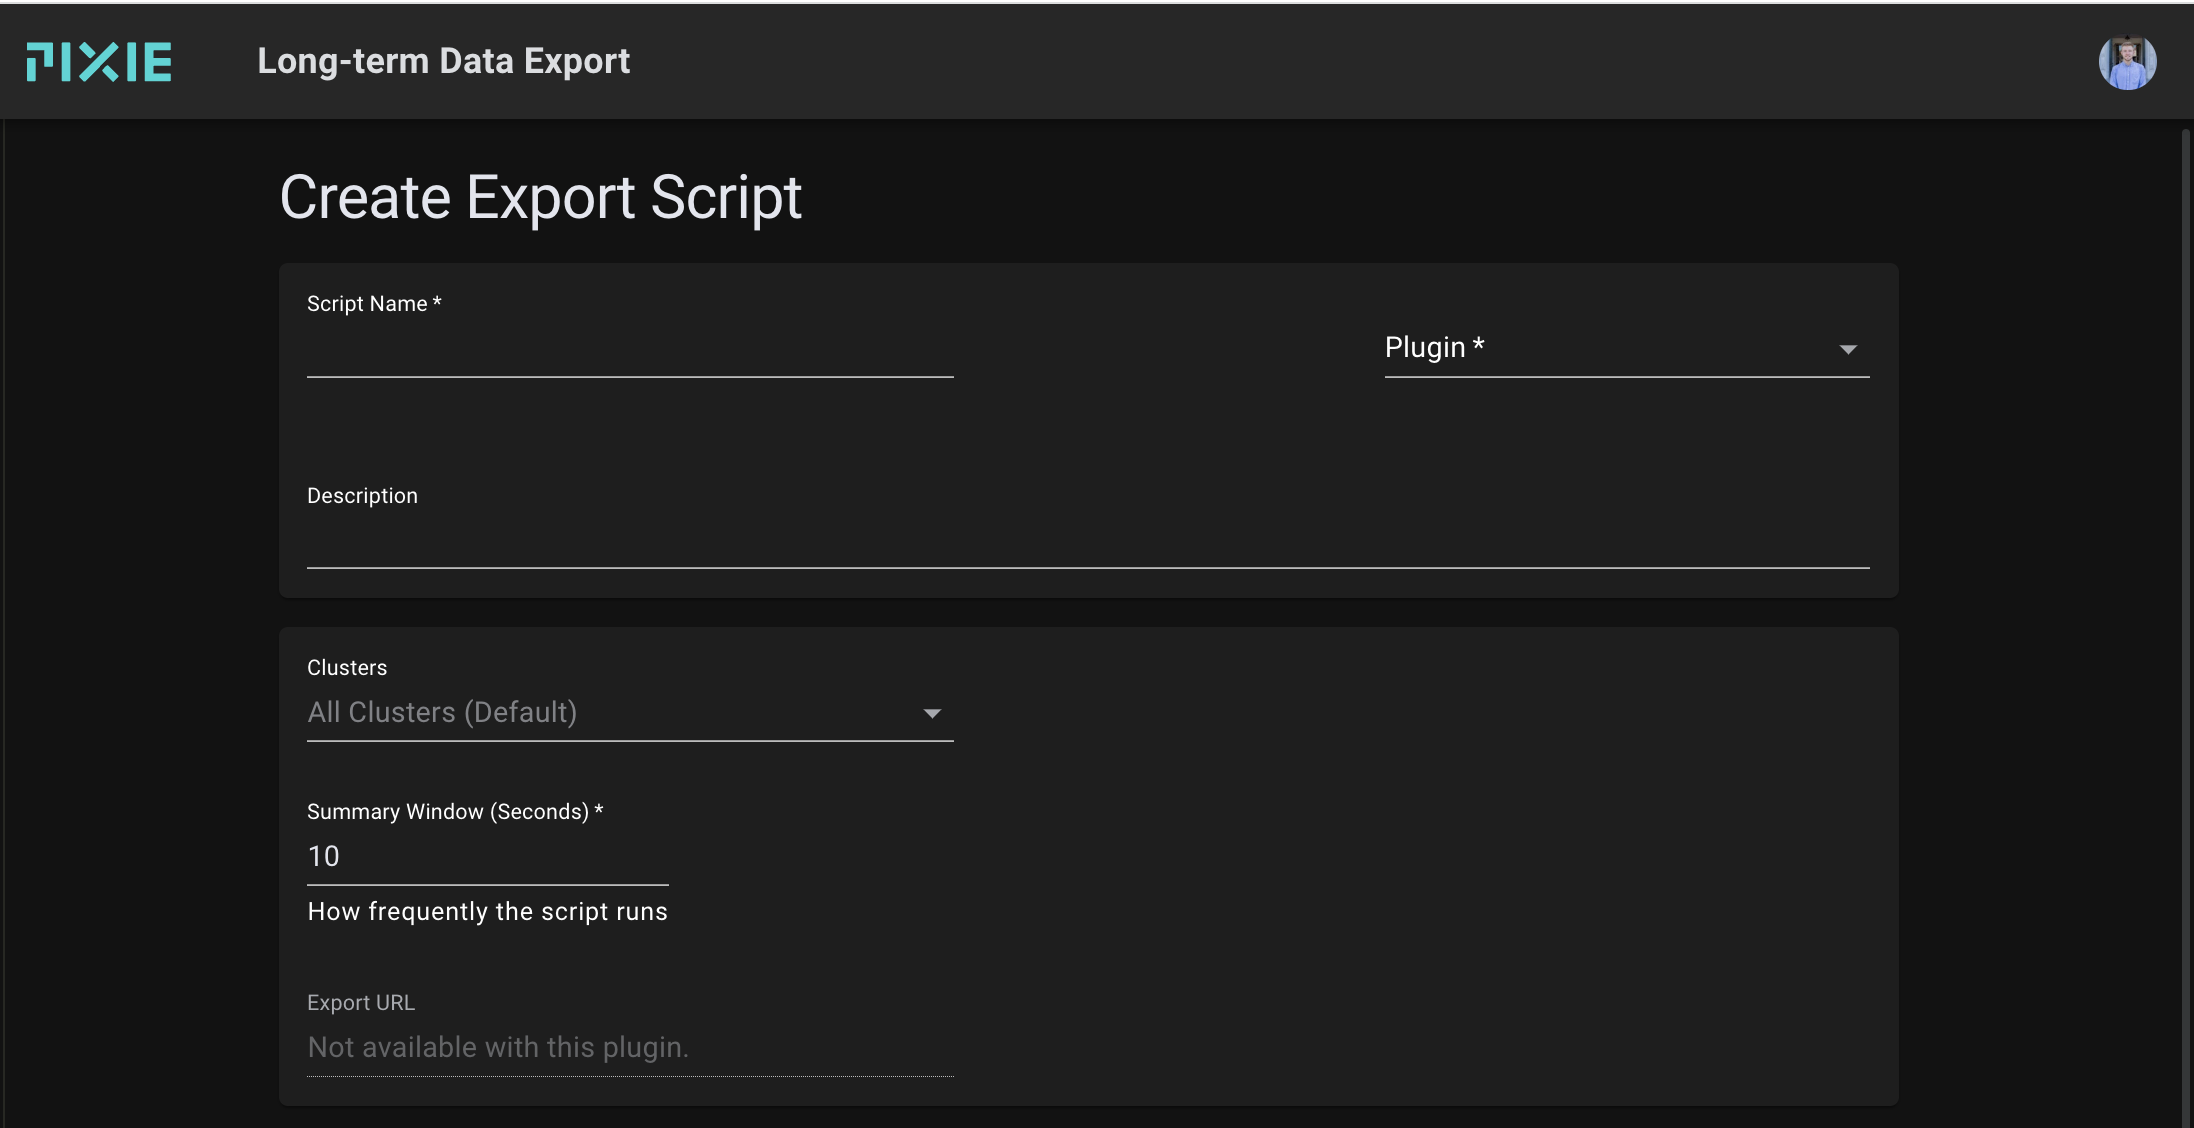
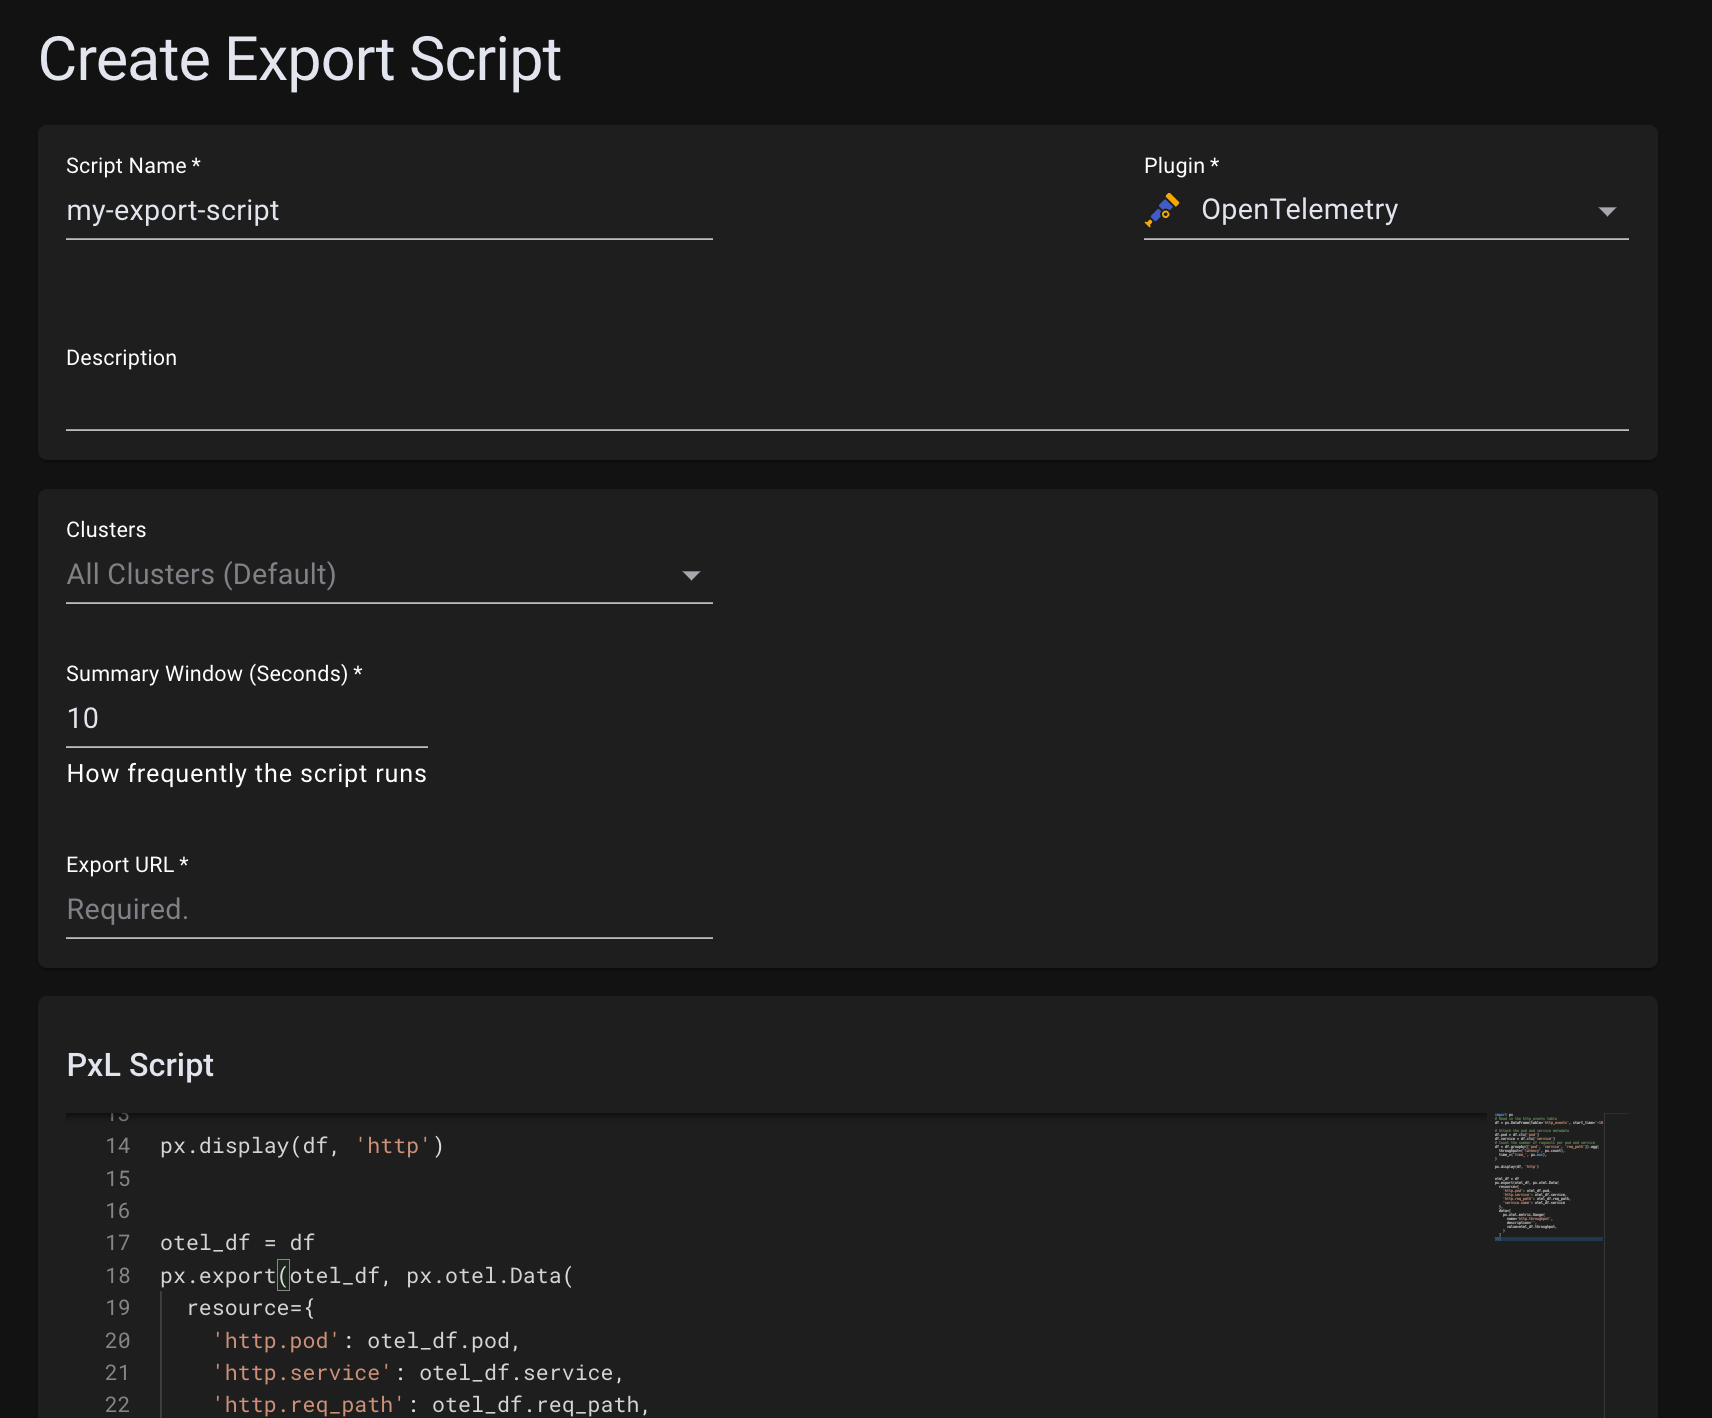
If the export is successful, you'll be directed to the "Create Export Script" page with the generated OpenTelemetry Export Script already filled in!

Read over the generated script and make any changes such as adding resource columns or removing undesired metrics. See How it Works for more on how the script is generated.
Set the name of the script to
my-export-scriptand set the Plugin provider toOpenTelemetry.
Click
Createand you should seemy-export-scriptin the "Custom Scripts" section. Your data should now be sent to whatever Plugin you configured.
When you export a PxL script, we extract the schema generated by the script and auto-generate the OpenTelemetry Export PxL for each table.
INT64 and FLOAT64 columns become Gauges while other column types become the
resource attributes of the exported Data.
Any calls to px.DataFrame are rewritten to replace the start_time argument with px.plugin.start_time and end_time argument with px.plugin.end_time.
These arguments are filled in by the Plugin script-runner with the start and end times of the current summary window. The summary window size can be configured
on the "Create Export Script" page.
You've now converted your first PxL script into an OpenTelemetry export script. You can dive deeper into PxL scripts by checking out our "How to Write a PxL Script" series or by reading through the PxL documentation.
You can also learn more about Pixie's OpenTelemetry integration in this tutorial and through the OpenTelemetry Export documentation.
Having problems? Check out the Pixie Plugin Troubleshooting guide.